1940‘s – 1950‘s – 1960‘s – 1970‘s – 1980‘s – 1990‘s – 2000‘s – 2010‘s – 2020‘s
This was the decade when we said goodbye to “State Contest” and hello to “MPA,” short for “Music Performance Assessment.” The number of bands participating rose. The percentage of bands receiving “Superior” ratings also rose.
2010
The name of the event underwent another change: Alabama Bandmasters Association Music Performance Assessment. Bands were adjudicated at the district level. In addition to the ratings of “Superior,” “Excellent,” “Good,” or “Fair,” a band receiving an “A” in every area from all four judges would receive a rating of “Superior with Distinction.” A band could also participate for “Comment only.”
The distribution of ratings of the 350 bands across the state is as follows:
- Superior with Distinction 42 (12%)
- Superior 177 (50%)
- Combination of “Superior” and “Superior with Distinction” 219 (62%)
- Excellent 104 (30%)
- Good 16 (5%)
- Fair 2 (.5%)
Comment Only 9 (2.5%)
2011
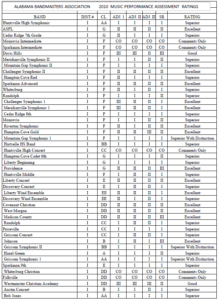
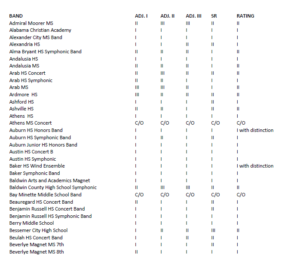
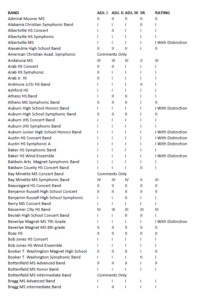
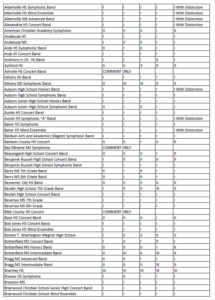
During the first several years of this “one level” event, the only record we have is the recap. While printed programs may have existed at each district, there was no system to organize those at the state level. Therefore, we have the band name. classification, and ratings, but do not have the names of directors or program selections.
The distribution of ratings of the 353 bands across the state is as follows:
- Superior with Distinction 47 (14%)
- Superior 156 (44%)
- Combination of “Superior” and “Superior with Distinction” 203 (58%)
- Excellent 107 (30%)
- Good 18 (5%)
- Fair 0 (0%)
- Comment Only 25 (7%)
2012
The distribution of ratings of the 340 bands across the state is as follows:
- Superior with Distinction 57 (16%)
- Superior 158 (44%)
- Combination of “Superior” and “Superior with Distinction” 215 (60%)
- Excellent 104 (29%)
- Good 19 (5%)
- Fair 2 (.5%)
- Comment Only 20 (5.5%)
2013
The distribution of ratings of the 387 bands across the state is as follows:
- Superior with Distinction 55 (14%)
- Superior 186 (48%)
- Combination of “Superior” and “Superior with Distinction” 241 (62%)
- Excellent 103 (27%)
- Good 14 (4%)
- Fair 0 (0%)
- Comment Only 29 (7%)
This year, the All-State Bronze Jazz Band was added to the festival.
2014
For the past several years, we have little archive data. With the Music Performance Assessment held at the district level, the Alabama Bandmasters Association had no system for collecting the kind of information we had when the festival was held at the state level.
Beginning this year, each director submitted their MPA registration via a portal called “ABAFest.” For each band, the information included the name of the director, the classification of the band, program selections, and even the number of students in the band.
Following MPA, each district chair would add to that information the ratings for each band. David Raney, band director at Sparkman High School at that time, coordinated ABAFest. Each year, Mr. Raney would email the information gathered to Dr. Frank Buck.
At the bottom of this page, you will see a compilation of the ratings from 2014 through 2021.
The distribution of ratings of the 403 bands across the state is as follows:
- Superior with Distinction 57 (14%)
- Superior 245 (61%)
- Combination of “Superior” and “Superior with Distinction” 302 (75%)
- Excellent 88 (22%)
- Good 13 (3%)
- Fair 0 (0%)
- Comment Only 27
Total bands participating 430
2015
The distribution of ratings of the 402 bands across the state is as follows:
- Superior with Distinction 53 (13%)
- Superior 216 (54%)
- Combination of “Superior” and “Superior with Distinction” 269 (67%)
- Excellent 114 (28%)
- Good 19 (5%)
- Fair 0 (0%)
- Comment Only 31
Total bands participating 433
2016
Beginning this year, the “Superior with Distinction” rating was eliminated.
The distribution of ratings of the 405 bands across the state is as follows:
- Superior 274 (68%)
- Excellent 115 (28%)
- Good 16(4%)
- Fair 0 (0%)
- Comment Only 26
Total bands participating 431
2017
The distribution of ratings of the 423 bands across the state is as follows:
- Superior 262 (62%)
- Excellent 123 (29%)
- Good 35(8%)
- Fair 3 (1%)
- Comment Only 27
Total bands participating 450
2018
This year saw a change in how bands chose program selections. From its inception, high school bands were classified based on the enrollment of the school. The Alabama Bandmasters Association maintained an approved music list for each classification. A band was required to play at least one selection from the list equal to or higher than the band’s classification. A band could also request to play a selection not from the list, but that request was granted only if the rigor of the piece matched the classification of the band.
Beginning this year, a band could play from any list. The classification of the band would be determined by the classification of the music selected.
The distribution of ratings of the 408 bands across the state is as follows:
- Superior 297 (73%)
- Excellent 97 (24%)
- Good 14 (3%)
- Fair 0 (0%)
- Comment Only 30
Total bands participating 438
2019
The distribution of ratings of the 409 bands across the state is as follows:
- Superior 278 (68%)
- Excellent 111 (27%)
- Good 20 (5%)
- Fair 0 (0%)
- Comment Only 24
Total bands participating 433
2014-2022 Spreadsheet
Click the button to download the spreadsheet:
When you open the spreadsheet, look for a message towards the top that says you are in “Protected View.” If you see that, look for a link that says “Enable Editing.” Click on that link.
What can you do with this spreadsheet?
From there, scroll from year to year to see the bands, the directors who led them, the music they played, and the ratings they received. As you scroll to the right, you will see some of the left-hand columns stay in place. That way, the name of the school is always visible as you scroll across the screen.
When you scroll to the bottom, you will see totals (or averages, as appropriate) of what is represented on the screen.
At the top of each column, you see a filter. It is represented as a downward-pointing arrow. Click a filter and you are able to narrow down what is shown on the spreadsheet. You can have more than one column filtered at a time. For example, you might be interested to see which Class B bands from District IV earned a “Superior” rating in 2016. Select what you want from each column. Your results appear. The last row will show the totals or averages for the bands displayed. It’s a good idea to “unfilter” the columns once you finish so that all rows appear again.
You will find you cannot change the data. This feature is by design. Nobody should be able to change ratings in the spreadsheet. If you see errors, please contact Dr. Frank Buck. His email address is Frank (at) FrankBuck (dot) org.


